
19 Mar From the top to the bottom: How did Bolivia get Here?
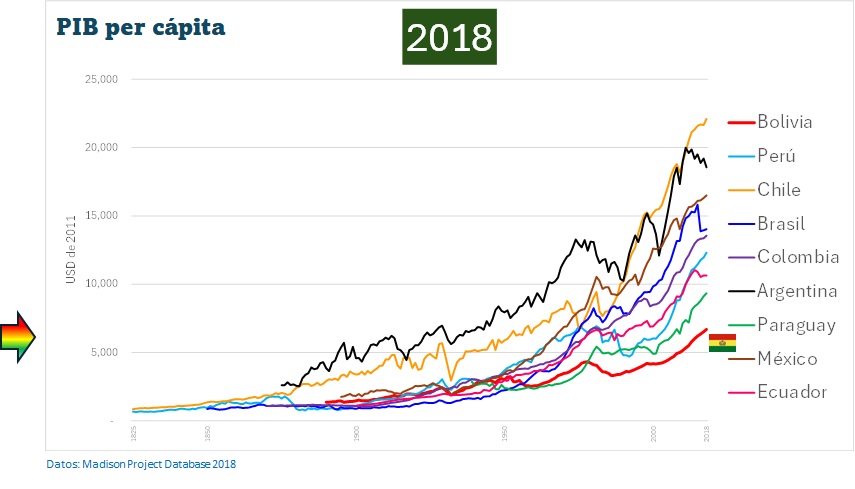
Today, I’d like to share valuable information from the Madison Project Database 2018, which offers historical GDP per capita data for numerous countries, reaching back to the 19th century. All figures are expressed in 2011 US dollars, allowing us to approximate the purchasing power of people over time. While GDP per capita isn’t a perfect measure, it’s what we have for this analysis.
The earliest data for Bolivia dates back to 1846, when its GDP per capita was similar to Chile’s and above Peru’s. Although it’s not shown in the chart, that same year the United States had a per capita income of $3,526—three times higher than Bolivia’s.

Moving to 1851, data for Bolivia isn’t available, but it’s interesting to note that Bolivia’s income in 1846 was still higher than Peru, Mexico, Brazil, and Colombia in 1851. By then, Argentina’s per capita income reached $1,994, surpassing both Spain ($1,720) and Japan ($1,436), signaling its rapid economic rise.

By 1890, Bolivia had fallen below Argentina, Chile, and Mexico, though it remained ahead of Brazil, Colombia, Peru, and Ecuador. Argentina, with $3,851 per capita, was nearing Germany ($3,870) and had surpassed Spain ($2,463) and Japan ($1,854).

In 1930, following the global crisis of 1929, GDP per capita declined across all countries, yet Bolivia still vied for third place among selected regional economies.

In 1952, Bolivia’s income ranked only above Paraguay and Brazil; by then, Peru, Colombia, and Mexico had all outpaced it.

In 1970, Bolivia’s per capita income barely edged out Paraguay’s.

Following the economic crisis of the 80s, Bolivia dropped to last place among the selected countries.

By 2000, Bolivia still ranked last, while Chile had caught up with Argentina.

Finally, in 2018, despite recent economic growth initiatives, Bolivia remained in last place among the selected countries. Remember that in 1846, the United States had three times Bolivia’s income. By 2018, the U.S. income was eight times greater.

These are the numbers. But the real question is: why? Each of us may have a different explanation. For those interested, I’ve created an animation of this data, available on my YouTube channel.
Warm regards, and let’s think about how to change this story.
S. Mauricio Medinaceli Monrroy
March 19, 2024
No Comments